Infographic
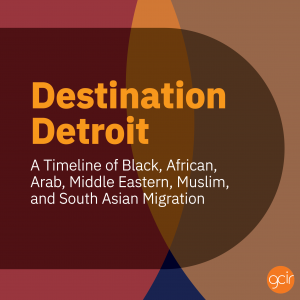
GCIR is thrilled to host our 2024 National Convening in Detroit, Michigan. To help tell the city's migration story, we have created "Destination Detroit: A Timeline of Black, African, Arab, Middle Eastern, Muslim, and South Asian Migration." This timeline is focused on the history of Black, African, Arab, Middle Eastern, Muslim, and South Asian (BAMEMSA) communities in the United States – from the arrival of Juan Garrido and Esteban de Dorantes in the 1500s, to the publication of The Life of Omar Ibn Said in 1831, to the arrival of Arab immigrants after the Civil War, to the Great Migration of African Americans out of the South through most of the 20th century, to the embrace of Islam by many Black Americans, to the emergence of a coordinated movement of BAMEMSA groups advocating for justice and dignity in the 21st century.
October 2024
Infographic
Resource
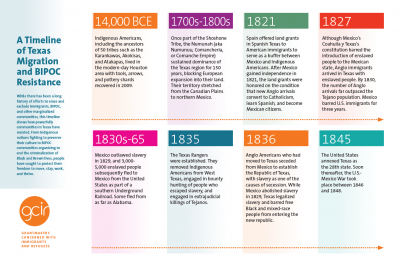
While there has been a long history of efforts to erase and exclude immigrants, BIPOC, and other marginalized communities, this timeline shows how powerfully communities in Texas have resisted. From Indigenous nations fighting to preserve their culture to BIPOC communities organizing to end the criminalization of Black and Brown lives, people have sought to protect their freedom to move, stay, work, and thrive.
May 2022
Infographic
Resource
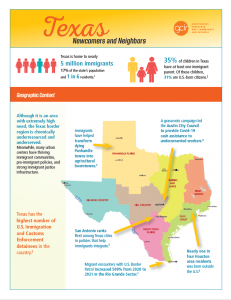
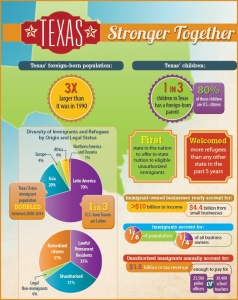
This two-page infographic looks at the foreign-born population in Texas, including legal status, regions of birth, geographic locations in the state, workforce and economic contributions, and other factors.
May 2022
Infographic
Resource
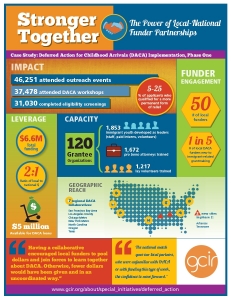
This two-page infographic summarizes the mission, vision, and impact of Delivering on the Dream.
September 2020
Infographic
Resource
This four-page timeline summarizes immigrant and refugee policy developments and philanthropic responses from 1990 to 2020.

March 2020
Infographic
Resource
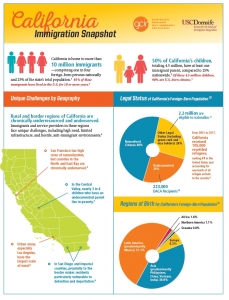
An at-a-glance overview of the immigration landscape in California, featuring demographic information about California’s large and diverse immigrant and refugee populations and unique challenges facing different regions of the state.
February 2018
Infographic
Resource
This one-page infographic summarizes the Delivering on the Dream network's impact, leverage, reach, and other metrics between mid-2015 and mid-2017.
July 2017
Infographic
Resource
The face of Texas is changing. Over the past two decades, a rising foreign-born population has reshaped the Lone Star state. This infographic considers some of the most dramatic changes--and impacts--that have occurred in the state.
October 2016
Infographic
Resource
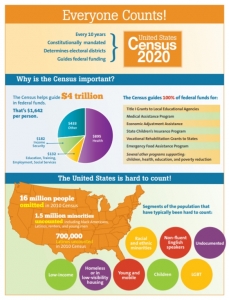
This infographic explains why the 2020 Census is important, why it's difficult to do accurately, and gives funding recommendations.
October 2016
Funding Recommendations, Infographic
Resource
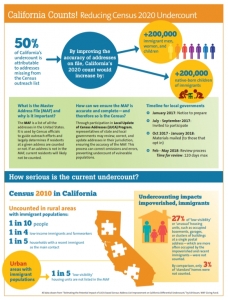
This infographic covers reviews the populations the Census typically undercounts in California, why there is a state undercount, and how that undercount can be reduced in 2020.
October 2016
Infographic
Resource